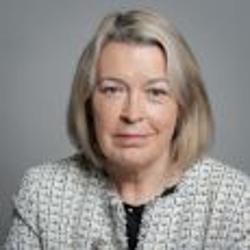
Baroness Keeley
Labour - Worsley and Eccles South
Joined House of Lords: 13th August 2024
Barbara Keeley was elected as an MP between 2005 and 2024. She served as Parliamentary Secretary and Deputy Leader of the House of Commons between 2009 and 2010 and as Shadow Minister (Culture, Media and Sport) between 2022 and 2024.
8 APPG Officer Positions (as of 12 Oct 2026)
Classical Music, Film and Broader Screen, Music Education, Opera, Tennis, Theatre, Ticket Abuse, Young Carers and Young Adult Carers7 APPG Memberships
Healthy Places, Bus and Coach, Carers, Haemophilia and Contaminated Blood, Homelessness, Performing Arts Education and Training, Sepsis16 Former APPG Officer Positions
Ageing and Older People, Carers, Coronavirus, Coronavirus and Future Pandemics, Cricket, Haemophilia and Contaminated Blood, Inappropriate Institutional Care of Autistic People and People with Learning Disabilities, Investment Fraud, Kidney, Learning Disability, Motor Neurone Disease, Social Work, Special Educational Needs and Disabilities, State Pension Inequality for Women, Ukraine, Women's Sport and FitnessDivision Voting information
Baroness Keeley voted Aye - against a party majority and in line with the House
One of 18 Labour Aye votes vs 114 Labour No votes
Tally: Ayes - 289 Noes - 118
Debates during the 2024 Parliament
Speeches made during Parliamentary debates are recorded in Hansard. For ease of browsing we have grouped debates into individual, departmental and legislative categories.
Sparring Partners
Minister of State (Department for Work and Pensions)
(12 debate interactions)
Department Debates
(18 debate contributions)
(11 debate contributions)
(10 debate contributions)
(5 debate contributions)
Legislation Debates
(4,351 words contributed)
(3,335 words contributed)
(687 words contributed)
Lords initiatives
These initiatives were driven by Baroness Keeley, and are more likely to reflect personal policy preferences.
3 Bills introduced by Baroness Keeley
A Bill to provide that people in receipt of Universal Credit and Housing Benefit and accommodated in the social housing sector be entitled to an additional bedroom related to caring responsibilities or overnight care; and for connected purposes.
Tuesday 14th October 2014
The Bill failed to complete its passage through Parliament before the end of the session. This means the Bill will make no further progress.
Wednesday 20th June 2012
The Bill failed to complete its passage through Parliament before the end of the session. This means the Bill will make no further progress. A Bill to require health bodies and general medical practitioners, and certain other organisations, to identify patients who are carers or who have a carer; to require identified carers to be referred to sources of help and support and to make further provision in relation to such arrangements; to make provision in relation to the responsibilities of local authorities and schools for the needs of young carers and their families; and for connected purposes;
Wednesday 14th July 2010
6 Bills co-sponsored by Baroness Keeley
Multi-storey car parks (safety) Bill 2022-23
Sponsor - Maria Eagle (Lab)
Quad Bikes Bill 2021-22
Sponsor - Judith Cummins (Lab)
Planning and Local Representation Bill 2021-22
Sponsor - Rachel Hopkins (Lab)
Disabled Facilities Grants (Review) Bill 2019-21
Sponsor - Liz Twist (Lab)
House of Lords (Exclusion of Hereditary Peers) Bill 2017-19
Sponsor - Lord Hanson of Flint (Lab)
Reproductive Health (Access to Terminations) Bill 2016-17
Sponsor - Diana Johnson (Lab)
Latest 5 Written Questions
(View all written questions)Information on the state-funded school workforce in England is published annually in the ‘School workforce in England’ statistical release, available on GOV.UK. The release includes published statistics on teachers’ qualifications.
The tables below provide the additional breakdowns requested in these questions for the 2012/13 to 2025/26 academic years, covering the number of teachers, the regional breakdown and the proportion of state-funded primary schools with at least one such teacher. Figures are provided separately for music, drama and art. Qualifications in dance cannot be separately identified in the School Workforce Census qualifications data. Data for the 2026/27 academic year will be collected later this term and published next summer.
Headcount number of state primary school teachers with a degree-level (or higher) qualification in music, drama or art between 2012/13 and 2025/26
| 2012/13 | 2013/14 | 2014/15 | 2015/16 | 2016/17 | 2017/18 | 2018/19 | 2019/20 | 2020/21 | 2021/22 | 2022/23 | 2023/24 | 2024/25 | 2025/26 |
Art and Design | 15,659 | 15,727 | 15,915 | 15,869 | 15,785 | 15,356 | 14,894 | 14,528 | 14,304 | 13,946 | 13,636 | 13,174 | 12,712 | 12,204 |
Drama | 6,694 | 7,067 | 7,454 | 7,710 | 7,958 | 7,904 | 7,821 | 7,809 | 7,814 | 7,818 | 7,840 | 7,567 | 7,347 | 7,125 |
Music | 7,551 | 7,666 | 7,833 | 7,868 | 7,852 | 7,608 | 7,380 | 7,176 | 7,067 | 6,927 | 6,686 | 6,345 | 6,033 | 5,707 |
Proportion of state primary schools with at least one teacher with a degree-level (or higher) qualification in music, drama or art between 2012/13 and 2025/26
| 2012/13 | 2013/14 | 2014/15 | 2015/16 | 2016/17 | 2017/18 | 2018/19 | 2019/20 | 2020/21 | 2021/22 | 2022/23 | 2023/24 | 2024/25 | 2025/26 |
Art and Design | 56.8 | 56.6 | 56.9 | 56.6 | 56.1 | 55.4 | 54.3 | 53.5 | 53.2 | 52.4 | 51.8 | 50.6 | 49.6 | 48.3 |
Drama | 30.6 | 31.9 | 33.0 | 33.8 | 34.7 | 34.8 | 34.2 | 34.1 | 34.1 | 34.2 | 34.2 | 33.5 | 32.8 | 32.2 |
Music | 34.9 | 35.2 | 35.8 | 35.9 | 35.7 | 34.9 | 34.0 | 33.1 | 32.6 | 32.1 | 31.1 | 29.8 | 28.8 | 27.6 |
Headcount number of state primary school teachers with a degree-level (or higher) qualification in music, drama or art by region between 2012/13 and 2025/26
| 2012/13 | 2013/14 | 2014/15 | 2015/16 | 2016/17 | 2017/18 | 2018/19 | 2019/20 | 2020/21 | 2021/22 | 2022/23 | 2023/24 | 2024/25 | 2025/26 |
Art and Design | ||||||||||||||
East Midlands | 1,409 | 1,400 | 1,431 | 1,439 | 1,399 | 1,381 | 1,343 | 1,313 | 1,297 | 1,273 | 1,268 | 1,216 | 1,171 | 1,137 |
East of England | 1,721 | 1,756 | 1,801 | 1,785 | 1,783 | 1,754 | 1,743 | 1,699 | 1,665 | 1,631 | 1,608 | 1,595 | 1,535 | 1,476 |
Inner London | 909 | 971 | 1,007 | 1,017 | 1,037 | 1,011 | 950 | 960 | 924 | 869 | 819 | 777 | 730 | 665 |
North East | 630 | 619 | 637 | 636 | 619 | 588 | 575 | 575 | 573 | 577 | 550 | 530 | 503 | 479 |
North West | 1,935 | 1,938 | 1,985 | 1,943 | 1,912 | 1,869 | 1,794 | 1,756 | 1,736 | 1,722 | 1,696 | 1,664 | 1,607 | 1,534 |
Outer London | 1,434 | 1,499 | 1,510 | 1,499 | 1,489 | 1,438 | 1,399 | 1,338 | 1,290 | 1,210 | 1,182 | 1,134 | 1,069 | 1,054 |
South East | 2,585 | 2,568 | 2,568 | 2,616 | 2,620 | 2,543 | 2,513 | 2,421 | 2,420 | 2,370 | 2,326 | 2,257 | 2,163 | 2,079 |
South West | 1,686 | 1,669 | 1,677 | 1,682 | 1,717 | 1,622 | 1,579 | 1,537 | 1,553 | 1,501 | 1,475 | 1,434 | 1,386 | 1,330 |
West Midlands | 1,930 | 1,918 | 1,901 | 1,864 | 1,847 | 1,820 | 1,745 | 1,695 | 1,646 | 1,642 | 1,586 | 1,481 | 1,471 | 1,414 |
Yorkshire and The Humber | 1,420 | 1,389 | 1,398 | 1,388 | 1,362 | 1,330 | 1,253 | 1,234 | 1,200 | 1,151 | 1,126 | 1,086 | 1,077 | 1,036 |
Drama | ||||||||||||||
East Midlands | 606 | 618 | 665 | 690 | 715 | 716 | 734 | 712 | 733 | 723 | 721 | 696 | 681 | 651 |
East of England | 741 | 781 | 815 | 854 | 879 | 890 | 895 | 915 | 903 | 885 | 895 | 870 | 840 | 825 |
Inner London | 448 | 519 | 582 | 584 | 612 | 602 | 585 | 567 | 558 | 545 | 538 | 500 | 476 | 429 |
North East | 173 | 179 | 197 | 220 | 231 | 223 | 219 | 216 | 221 | 217 | 217 | 210 | 206 | 187 |
North West | 803 | 842 | 880 | 918 | 943 | 946 | 935 | 954 | 925 | 953 | 978 | 968 | 927 | 945 |
Outer London | 762 | 822 | 853 | 862 | 877 | 845 | 818 | 826 | 806 | 799 | 784 | 764 | 728 | 692 |
South East | 1,278 | 1,334 | 1,392 | 1,469 | 1,512 | 1,503 | 1,467 | 1,486 | 1,521 | 1,511 | 1,499 | 1,432 | 1,392 | 1,338 |
South West | 696 | 741 | 769 | 786 | 815 | 816 | 814 | 795 | 810 | 838 | 851 | 822 | 794 | 776 |
West Midlands | 556 | 575 | 609 | 638 | 659 | 668 | 671 | 666 | 654 | 670 | 683 | 655 | 660 | 651 |
Yorkshire and The Humber | 631 | 656 | 692 | 689 | 715 | 695 | 683 | 672 | 683 | 677 | 674 | 650 | 643 | 631 |
Music | ||||||||||||||
East Midlands | 664 | 659 | 662 | 669 | 659 | 654 | 650 | 625 | 623 | 615 | 573 | 541 | 513 | 479 |
East of England | 901 | 925 | 948 | 957 | 968 | 936 | 902 | 875 | 857 | 826 | 805 | 746 | 717 | 687 |
Inner London | 355 | 384 | 419 | 417 | 438 | 416 | 413 | 410 | 385 | 361 | 332 | 329 | 303 | 278 |
North East | 259 | 256 | 260 | 255 | 268 | 259 | 260 | 245 | 242 | 241 | 221 | 223 | 209 | 215 |
North West | 974 | 986 | 993 | 1,008 | 1,008 | 951 | 930 | 903 | 895 | 866 | 857 | 821 | 780 | 746 |
Outer London | 624 | 645 | 680 | 671 | 641 | 624 | 569 | 582 | 578 | 565 | 544 | 505 | 498 | 454 |
South East | 1,343 | 1,344 | 1,366 | 1,390 | 1,400 | 1,361 | 1,308 | 1,275 | 1,275 | 1,257 | 1,225 | 1,171 | 1,115 | 1,065 |
South West | 882 | 923 | 930 | 937 | 923 | 901 | 880 | 861 | 854 | 854 | 830 | 787 | 737 | 700 |
West Midlands | 777 | 787 | 799 | 788 | 781 | 762 | 744 | 709 | 680 | 688 | 660 | 628 | 602 | 565 |
Yorkshire and The Humber | 772 | 757 | 776 | 776 | 766 | 744 | 724 | 691 | 678 | 654 | 639 | 594 | 559 | 518 |
Source: School Workforce Census
Note: state primary schools includes states nursery schools
Minister of State (Department for Work and Pensions)
Information on the state-funded school workforce in England is published annually in the ‘School workforce in England’ statistical release, available on GOV.UK. The release includes published statistics on teachers’ qualifications.
The tables below provide the additional breakdowns requested in these questions for the 2012/13 to 2025/26 academic years, covering the number of teachers, the regional breakdown and the proportion of state-funded primary schools with at least one such teacher. Figures are provided separately for music, drama and art. Qualifications in dance cannot be separately identified in the School Workforce Census qualifications data. Data for the 2026/27 academic year will be collected later this term and published next summer.
Headcount number of state primary school teachers with a degree-level (or higher) qualification in music, drama or art between 2012/13 and 2025/26
| 2012/13 | 2013/14 | 2014/15 | 2015/16 | 2016/17 | 2017/18 | 2018/19 | 2019/20 | 2020/21 | 2021/22 | 2022/23 | 2023/24 | 2024/25 | 2025/26 |
Art and Design | 15,659 | 15,727 | 15,915 | 15,869 | 15,785 | 15,356 | 14,894 | 14,528 | 14,304 | 13,946 | 13,636 | 13,174 | 12,712 | 12,204 |
Drama | 6,694 | 7,067 | 7,454 | 7,710 | 7,958 | 7,904 | 7,821 | 7,809 | 7,814 | 7,818 | 7,840 | 7,567 | 7,347 | 7,125 |
Music | 7,551 | 7,666 | 7,833 | 7,868 | 7,852 | 7,608 | 7,380 | 7,176 | 7,067 | 6,927 | 6,686 | 6,345 | 6,033 | 5,707 |
Proportion of state primary schools with at least one teacher with a degree-level (or higher) qualification in music, drama or art between 2012/13 and 2025/26
| 2012/13 | 2013/14 | 2014/15 | 2015/16 | 2016/17 | 2017/18 | 2018/19 | 2019/20 | 2020/21 | 2021/22 | 2022/23 | 2023/24 | 2024/25 | 2025/26 |
Art and Design | 56.8 | 56.6 | 56.9 | 56.6 | 56.1 | 55.4 | 54.3 | 53.5 | 53.2 | 52.4 | 51.8 | 50.6 | 49.6 | 48.3 |
Drama | 30.6 | 31.9 | 33.0 | 33.8 | 34.7 | 34.8 | 34.2 | 34.1 | 34.1 | 34.2 | 34.2 | 33.5 | 32.8 | 32.2 |
Music | 34.9 | 35.2 | 35.8 | 35.9 | 35.7 | 34.9 | 34.0 | 33.1 | 32.6 | 32.1 | 31.1 | 29.8 | 28.8 | 27.6 |
Headcount number of state primary school teachers with a degree-level (or higher) qualification in music, drama or art by region between 2012/13 and 2025/26
| 2012/13 | 2013/14 | 2014/15 | 2015/16 | 2016/17 | 2017/18 | 2018/19 | 2019/20 | 2020/21 | 2021/22 | 2022/23 | 2023/24 | 2024/25 | 2025/26 |
Art and Design | ||||||||||||||
East Midlands | 1,409 | 1,400 | 1,431 | 1,439 | 1,399 | 1,381 | 1,343 | 1,313 | 1,297 | 1,273 | 1,268 | 1,216 | 1,171 | 1,137 |
East of England | 1,721 | 1,756 | 1,801 | 1,785 | 1,783 | 1,754 | 1,743 | 1,699 | 1,665 | 1,631 | 1,608 | 1,595 | 1,535 | 1,476 |
Inner London | 909 | 971 | 1,007 | 1,017 | 1,037 | 1,011 | 950 | 960 | 924 | 869 | 819 | 777 | 730 | 665 |
North East | 630 | 619 | 637 | 636 | 619 | 588 | 575 | 575 | 573 | 577 | 550 | 530 | 503 | 479 |
North West | 1,935 | 1,938 | 1,985 | 1,943 | 1,912 | 1,869 | 1,794 | 1,756 | 1,736 | 1,722 | 1,696 | 1,664 | 1,607 | 1,534 |
Outer London | 1,434 | 1,499 | 1,510 | 1,499 | 1,489 | 1,438 | 1,399 | 1,338 | 1,290 | 1,210 | 1,182 | 1,134 | 1,069 | 1,054 |
South East | 2,585 | 2,568 | 2,568 | 2,616 | 2,620 | 2,543 | 2,513 | 2,421 | 2,420 | 2,370 | 2,326 | 2,257 | 2,163 | 2,079 |
South West | 1,686 | 1,669 | 1,677 | 1,682 | 1,717 | 1,622 | 1,579 | 1,537 | 1,553 | 1,501 | 1,475 | 1,434 | 1,386 | 1,330 |
West Midlands | 1,930 | 1,918 | 1,901 | 1,864 | 1,847 | 1,820 | 1,745 | 1,695 | 1,646 | 1,642 | 1,586 | 1,481 | 1,471 | 1,414 |
Yorkshire and The Humber | 1,420 | 1,389 | 1,398 | 1,388 | 1,362 | 1,330 | 1,253 | 1,234 | 1,200 | 1,151 | 1,126 | 1,086 | 1,077 | 1,036 |
Drama | ||||||||||||||
East Midlands | 606 | 618 | 665 | 690 | 715 | 716 | 734 | 712 | 733 | 723 | 721 | 696 | 681 | 651 |
East of England | 741 | 781 | 815 | 854 | 879 | 890 | 895 | 915 | 903 | 885 | 895 | 870 | 840 | 825 |
Inner London | 448 | 519 | 582 | 584 | 612 | 602 | 585 | 567 | 558 | 545 | 538 | 500 | 476 | 429 |
North East | 173 | 179 | 197 | 220 | 231 | 223 | 219 | 216 | 221 | 217 | 217 | 210 | 206 | 187 |
North West | 803 | 842 | 880 | 918 | 943 | 946 | 935 | 954 | 925 | 953 | 978 | 968 | 927 | 945 |
Outer London | 762 | 822 | 853 | 862 | 877 | 845 | 818 | 826 | 806 | 799 | 784 | 764 | 728 | 692 |
South East | 1,278 | 1,334 | 1,392 | 1,469 | 1,512 | 1,503 | 1,467 | 1,486 | 1,521 | 1,511 | 1,499 | 1,432 | 1,392 | 1,338 |
South West | 696 | 741 | 769 | 786 | 815 | 816 | 814 | 795 | 810 | 838 | 851 | 822 | 794 | 776 |
West Midlands | 556 | 575 | 609 | 638 | 659 | 668 | 671 | 666 | 654 | 670 | 683 | 655 | 660 | 651 |
Yorkshire and The Humber | 631 | 656 | 692 | 689 | 715 | 695 | 683 | 672 | 683 | 677 | 674 | 650 | 643 | 631 |
Music | ||||||||||||||
East Midlands | 664 | 659 | 662 | 669 | 659 | 654 | 650 | 625 | 623 | 615 | 573 | 541 | 513 | 479 |
East of England | 901 | 925 | 948 | 957 | 968 | 936 | 902 | 875 | 857 | 826 | 805 | 746 | 717 | 687 |
Inner London | 355 | 384 | 419 | 417 | 438 | 416 | 413 | 410 | 385 | 361 | 332 | 329 | 303 | 278 |
North East | 259 | 256 | 260 | 255 | 268 | 259 | 260 | 245 | 242 | 241 | 221 | 223 | 209 | 215 |
North West | 974 | 986 | 993 | 1,008 | 1,008 | 951 | 930 | 903 | 895 | 866 | 857 | 821 | 780 | 746 |
Outer London | 624 | 645 | 680 | 671 | 641 | 624 | 569 | 582 | 578 | 565 | 544 | 505 | 498 | 454 |
South East | 1,343 | 1,344 | 1,366 | 1,390 | 1,400 | 1,361 | 1,308 | 1,275 | 1,275 | 1,257 | 1,225 | 1,171 | 1,115 | 1,065 |
South West | 882 | 923 | 930 | 937 | 923 | 901 | 880 | 861 | 854 | 854 | 830 | 787 | 737 | 700 |
West Midlands | 777 | 787 | 799 | 788 | 781 | 762 | 744 | 709 | 680 | 688 | 660 | 628 | 602 | 565 |
Yorkshire and The Humber | 772 | 757 | 776 | 776 | 766 | 744 | 724 | 691 | 678 | 654 | 639 | 594 | 559 | 518 |
Source: School Workforce Census
Note: state primary schools includes states nursery schools
Minister of State (Department for Work and Pensions)
Almost all T Level learners (92-93%) who completed their T Level in the first three cohorts were studying and/or working when surveyed after their course, with at least two thirds of students going on to work or study in the same field as their course. The department is expanding T Levels in subject areas including creative, so that more students can benefit from these strong progression opportunities.
We have already announced reforms to the delivery of industry placements, allowing greater scope for providers to determine appropriate delivery methods to facilitate placements for their students, including in creative sector settings.
We will continue to work with employers and providers to understand sector needs and to ensure that the T Level model supports this, ahead of new qualifications being introduced.
Minister of State (Department for Work and Pensions)
T Levels are demonstrating excellent outcomes. Almost all learners (92-93%) who completed their T Level in the first three cohorts were studying and/or working when surveyed after their course, with at least two thirds of students going on to work or study in the same field as their course. We are expanding T Levels in subject areas including creative, so that more students can benefit from these strong progression opportunities.
We have already announced reforms to the delivery of industry placements, allowing greater scope for providers to determine appropriate delivery methods to facilitate placements for their students, including in creative sector settings.
The department will continue to work with employers and providers to understand sector needs and to ensure that the T Level model supports this, ahead of new qualifications being introduced.
Minister of State (Department for Work and Pensions)